Velocity, burndown, cycle time, throughput, predictability and capacity — what each agile KPI actually measures, how to read it without fooling yourself, and how Sprint Bridge calculates them automatically from the first sprint.
Good agile metrics answer a specific question about delivery. Use them to start conversations in planning and retrospectives — not to rank teams or individuals.
| Metric | What it measures | The question it answers |
|---|---|---|
| Velocity | Story points completed per sprint | How much work does this team typically finish in a sprint? |
| Burndown / burnup | Work remaining (or completed) over the course of a sprint or release | Are we on track to finish what we committed to? |
| Cycle time | Time from work starting to work finished | Once we start something, how long does it take? |
| Lead time | Time from request created to delivered | How long does a customer or stakeholder wait? |
| Throughput | Number of items finished per period | How many things do we deliver each week? |
| Sprint predictability | Completed work as a share of committed work | Can stakeholders trust our sprint commitments? |
| Capacity | Available team time for a sprint, after leave and other work | How much should we commit to this sprint? |
The charts below use made-up sample data to show what each metric looks like and what to look for.
Velocity is the number of story points a team completes in a sprint. A velocity chart plots it sprint by sprint, usually with a rolling average.
How to read it: look at the trend and the spread, not a single sprint. A stable band means planning is reliable; big swings point to estimation drift, unplanned work or changing team membership. Use the average of the last three to five sprints as a starting point for the next commitment.
Watch out for: comparing velocity between teams. Story points are relative to each team, so a higher number doesn't mean a better team.
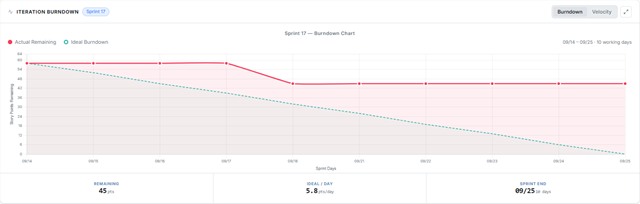
A burndown chart shows work remaining in the sprint day by day against an ideal straight line to zero. A burnup chart shows work completed rising toward a total-scope line — useful for releases because it makes scope changes visible instead of hiding them.
How to read it: a flat stretch early in the sprint usually means work is in progress but not finished — normal for a day or two, a warning sign if it lasts. A line that sits well above ideal past mid-sprint means the commitment is at risk; that's the moment to renegotiate scope, not the last day.
Watch out for: lines that jump up mid-sprint. That's scope being added, and it deserves a conversation in the retrospective.
Cycle time measures how long an item takes from "in progress" to "done". Lead time starts earlier, when the request is created, so it includes time waiting in the backlog. Throughput counts how many items finish per week or sprint. Together they're the core flow metrics for Kanban teams, and they're just as useful for Scrum teams.
How to read it: on a cycle-time scatter plot, each dot is a finished item. Use a percentile line rather than the average — "85% of items finish within 6 days" is a forecast you can give a stakeholder. Outliers above the line are worth a quick look: blocked work, oversized stories or hand-offs.
Watch out for: rising cycle time with flat throughput. It usually means too much work in progress — tighten WIP limits.
Predictability compares what a team committed to at sprint planning with what it actually finished — for example, 34 of 40 committed points is 85%. Consistently landing in a steady range matters more than hitting 100%: a team that always finishes everything may be under-committing. Track carry-over stories alongside it so unfinished work isn't silently re-estimated.
Capacity is the time a team actually has available in a sprint after holidays, leave, support rotations and meetings. Combine it with recent velocity: if a team averages 40 points at full strength and one of five engineers is out for the sprint, planning around 32 points is more honest than repeating last sprint's number.
No manual reporting and no custom queries. Sprint Bridge calculates its metrics in real time across every team and project, straight from the sprints, boards and stories your team already works in.
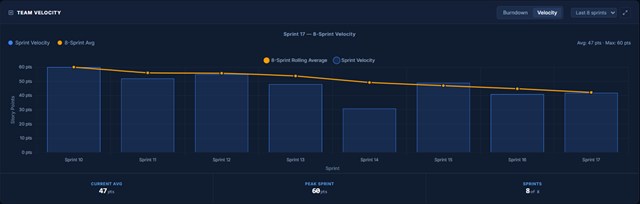
Historical velocity builds automatically from the first sprint, giving teams and leadership a reliable baseline for forecasting and commitment planning.
Live burndown data with predictive trend analysis flags early when a sprint is at risk — giving teams time to act, not just report.
Kanban and Hybrid projects include cumulative flow diagrams, lead time and cycle time analytics, throughput trend analysis and WIP limits per column.
Plan against real capacity with team roster management, skill tracking and availability calendars, plus capacity utilization and workload distribution insights for managers.
Sprint health indicators surface over-commitment, scope creep and delivery risk scores, while story continuation tracking keeps carry-over work connected across sprint boundaries.
Test coverage rates, defect discovery trends, testing velocity, quality gate metrics and defect escape rate give QA leads a clear view of release readiness.
Other metrics in the set include flow efficiency and lead time across teams and portfolios. See the complete list on the features page.
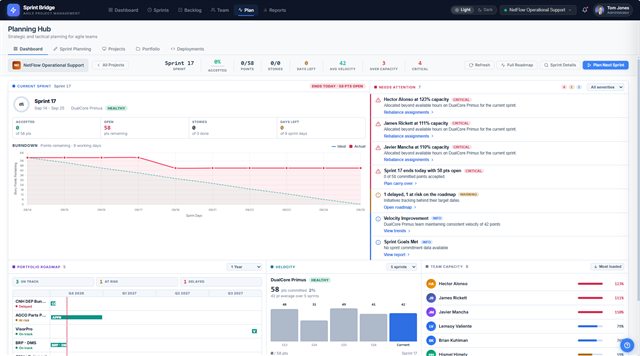
Team-level charts help Scrum Masters run sprints. Leaders need a different view: is delivery healthy across the portfolio, and where should we step in?
Sprint Bridge executive dashboards give leadership a real-time, portfolio-wide view of delivery health, team performance and business metrics without anyone assembling a slide deck. The Initiative → Epic → Feature → Story hierarchy keeps those numbers tied to strategic goals.

Every team gets velocity and burndown for free. Deeper analytics and BI dashboards come with the paid tiers. Full details are on the pricing page.
| Capability | Starter Free | Professional $3.99/user/mo | Business $7.99/user/mo | Enterprise Custom |
|---|---|---|---|---|
| Backlog, velocity & burndown | ✓ | ✓ | ✓ | ✓ |
| Core analytics & KPIs | ✓ | ✓ | ✓ | ✓ |
| Sprint & Kanban workflows | ✓ | ✓ | ✓ | ✓ |
| Hybrid workflow (Sprint + Kanban per project) | — | ✓ | ✓ | ✓ |
| Advanced analytics & 40+ KPIs | — | ✓ | ✓ | ✓ |
| Executive dashboards | — | ✓ | ✓ | ✓ |
| Advanced BI dashboards — 40+ KPIs | — | — | ✓ | ✓ |
| Portfolio & roadmap views | — | — | ✓ | ✓ |
| ASC 350-40 financial reporting | — | — | ✓ | ✓ |
Professional and Business prices shown per user per month, billed annually ($4.99 and $9.99 billed monthly). Starter is free forever for 1 project and up to 10 users.
Agile metrics, dashboards and how Sprint Bridge calculates them.
Start free on Starter — velocity, burndown and core KPIs included, no credit card and no time limit.